What is Bulletin?
Financial Institutions need stronger automation tools. Customers don’t have the time to handle the manaul conversion and data input of reports generation. Bullentin solves this by automating the entire process, pulling out your custom SQL data and generating a fully customised excel report.
In the Graphic User Interface (GUI), you can choose to fully customize the excel reports (colors, tables, and more), or even choose from a select few industry-standard templates.
We won finalists for the Goldman Sachs Engage Hackathon using this application.
How it works!
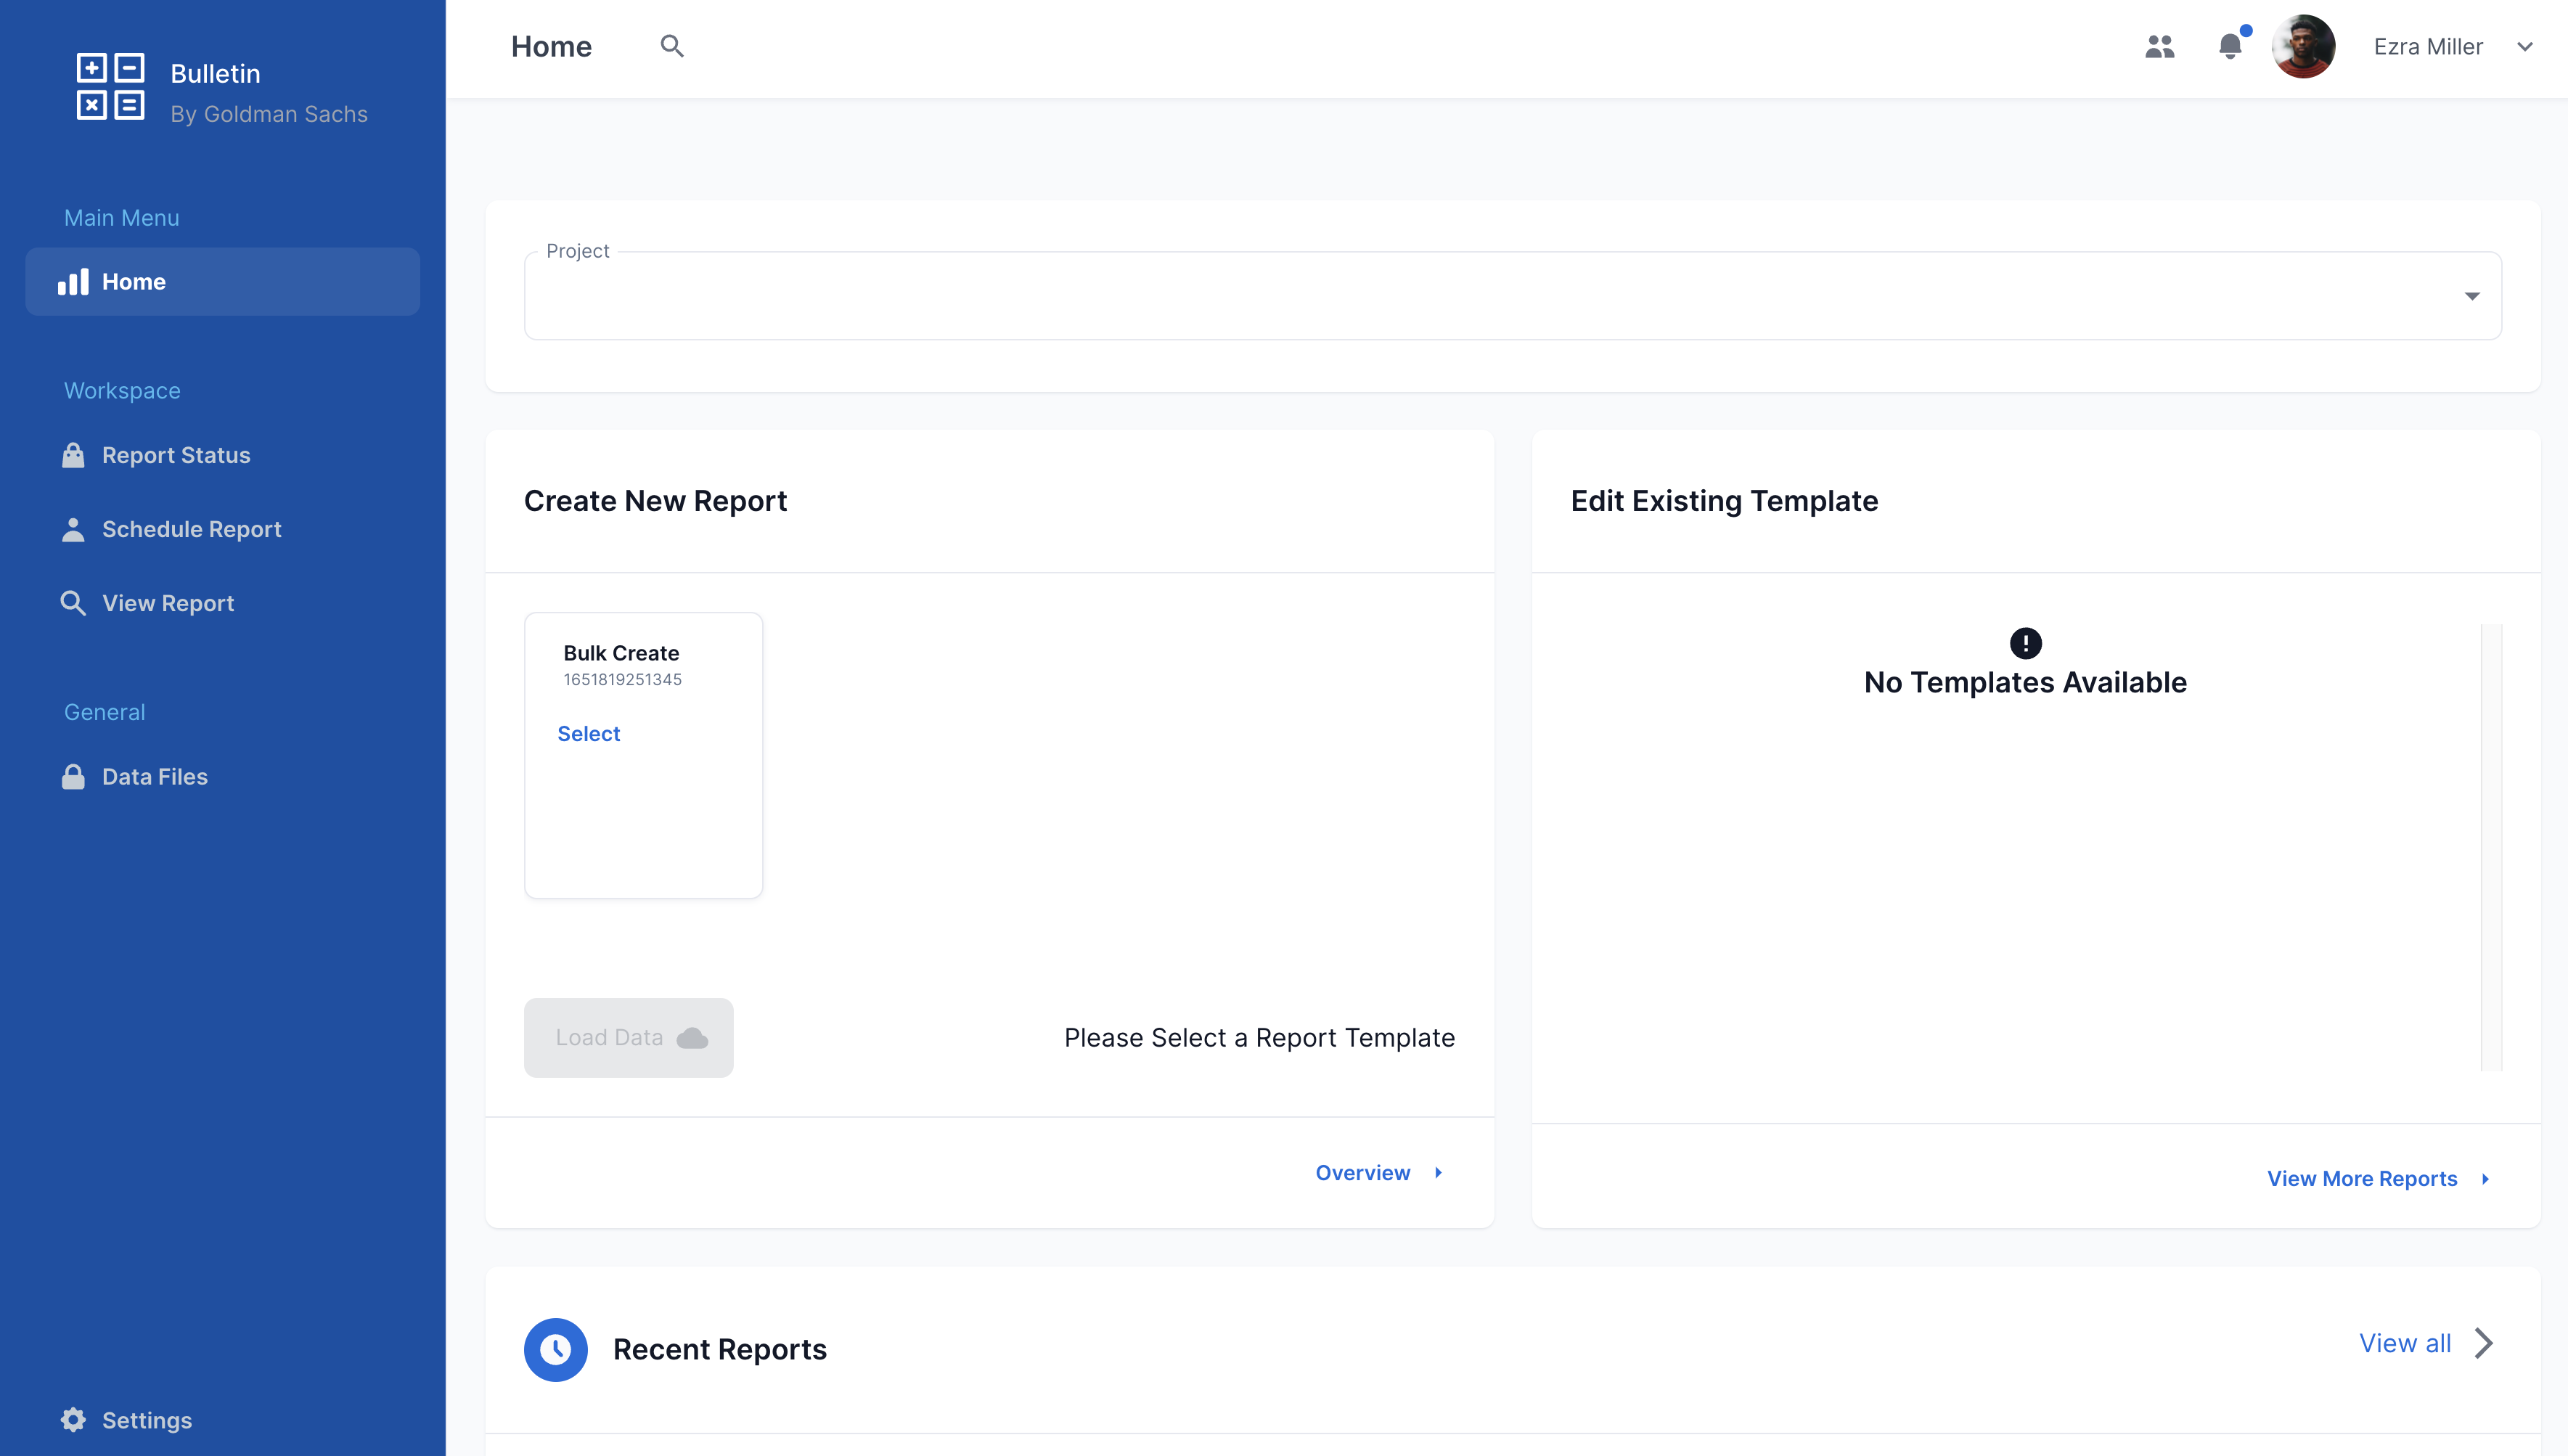
Login to your dashboard
You’ll start off by seeing your dashboard. Here you can visualize all your past reports, edit new report templates, and even view statistics for all your generated reports. You’ll have a sense of what reports are in the queue, and also the status of your different reports.
Setting up a project
Next, we’ll set up the project by uploading some files, and selecting which files we want to combine/edit.
Naming your files and sheets
We name our files and excel sheets that we want to eventually output.
Drag and drop capabilities to organise your tables
Now we can move onto the bulk of building the report. We have a fully customizable draggable interface for you to decide how exactly you want to place your tables, and also how you might want to order them.
Select columns for the different tables
We then proceed to decide which columns go into the different tables.
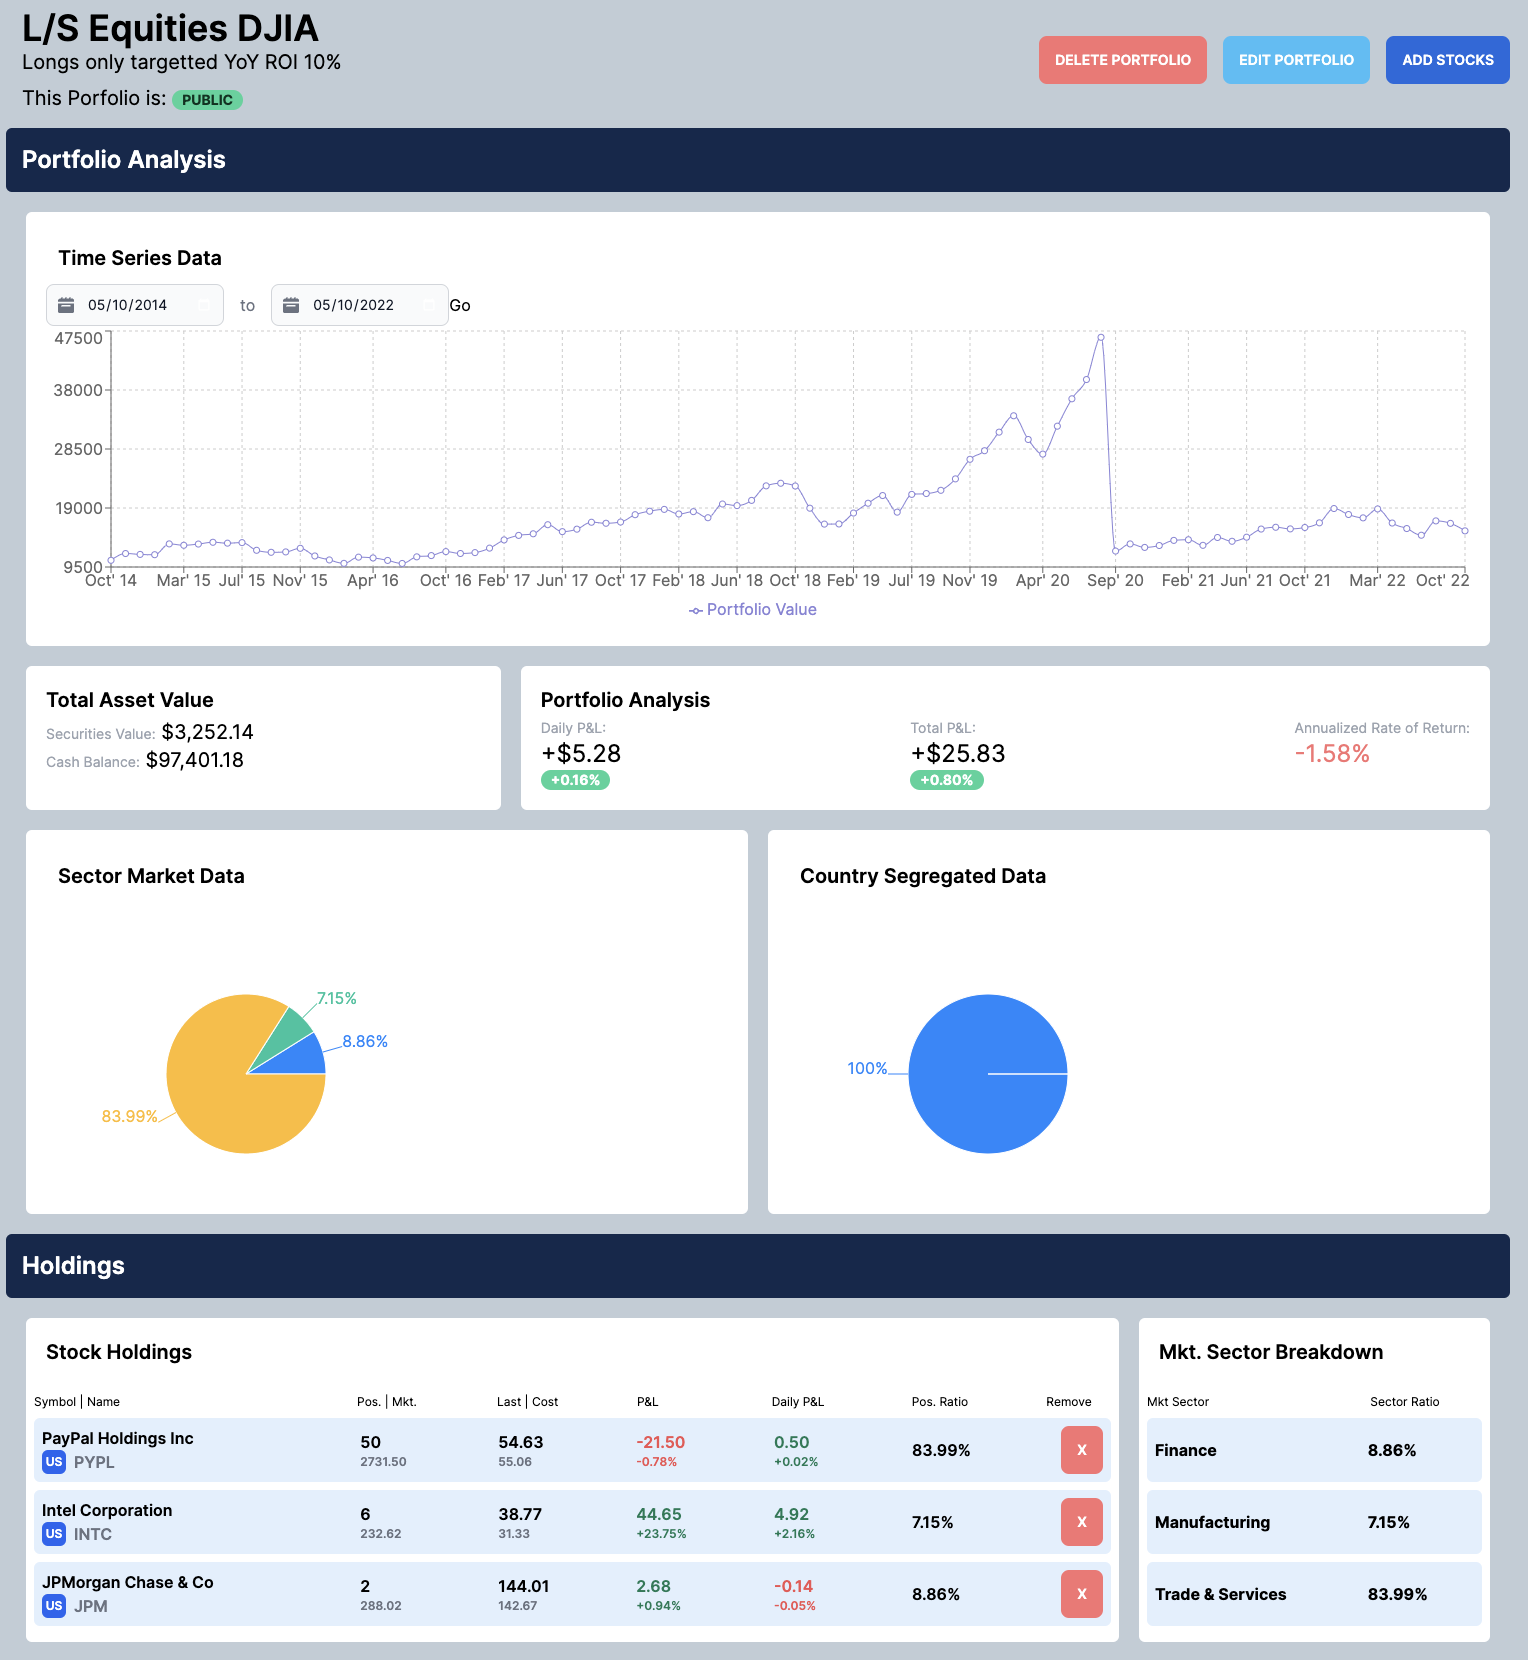
Final output of the excel report!
Finally, we can download a copy of our report! :)
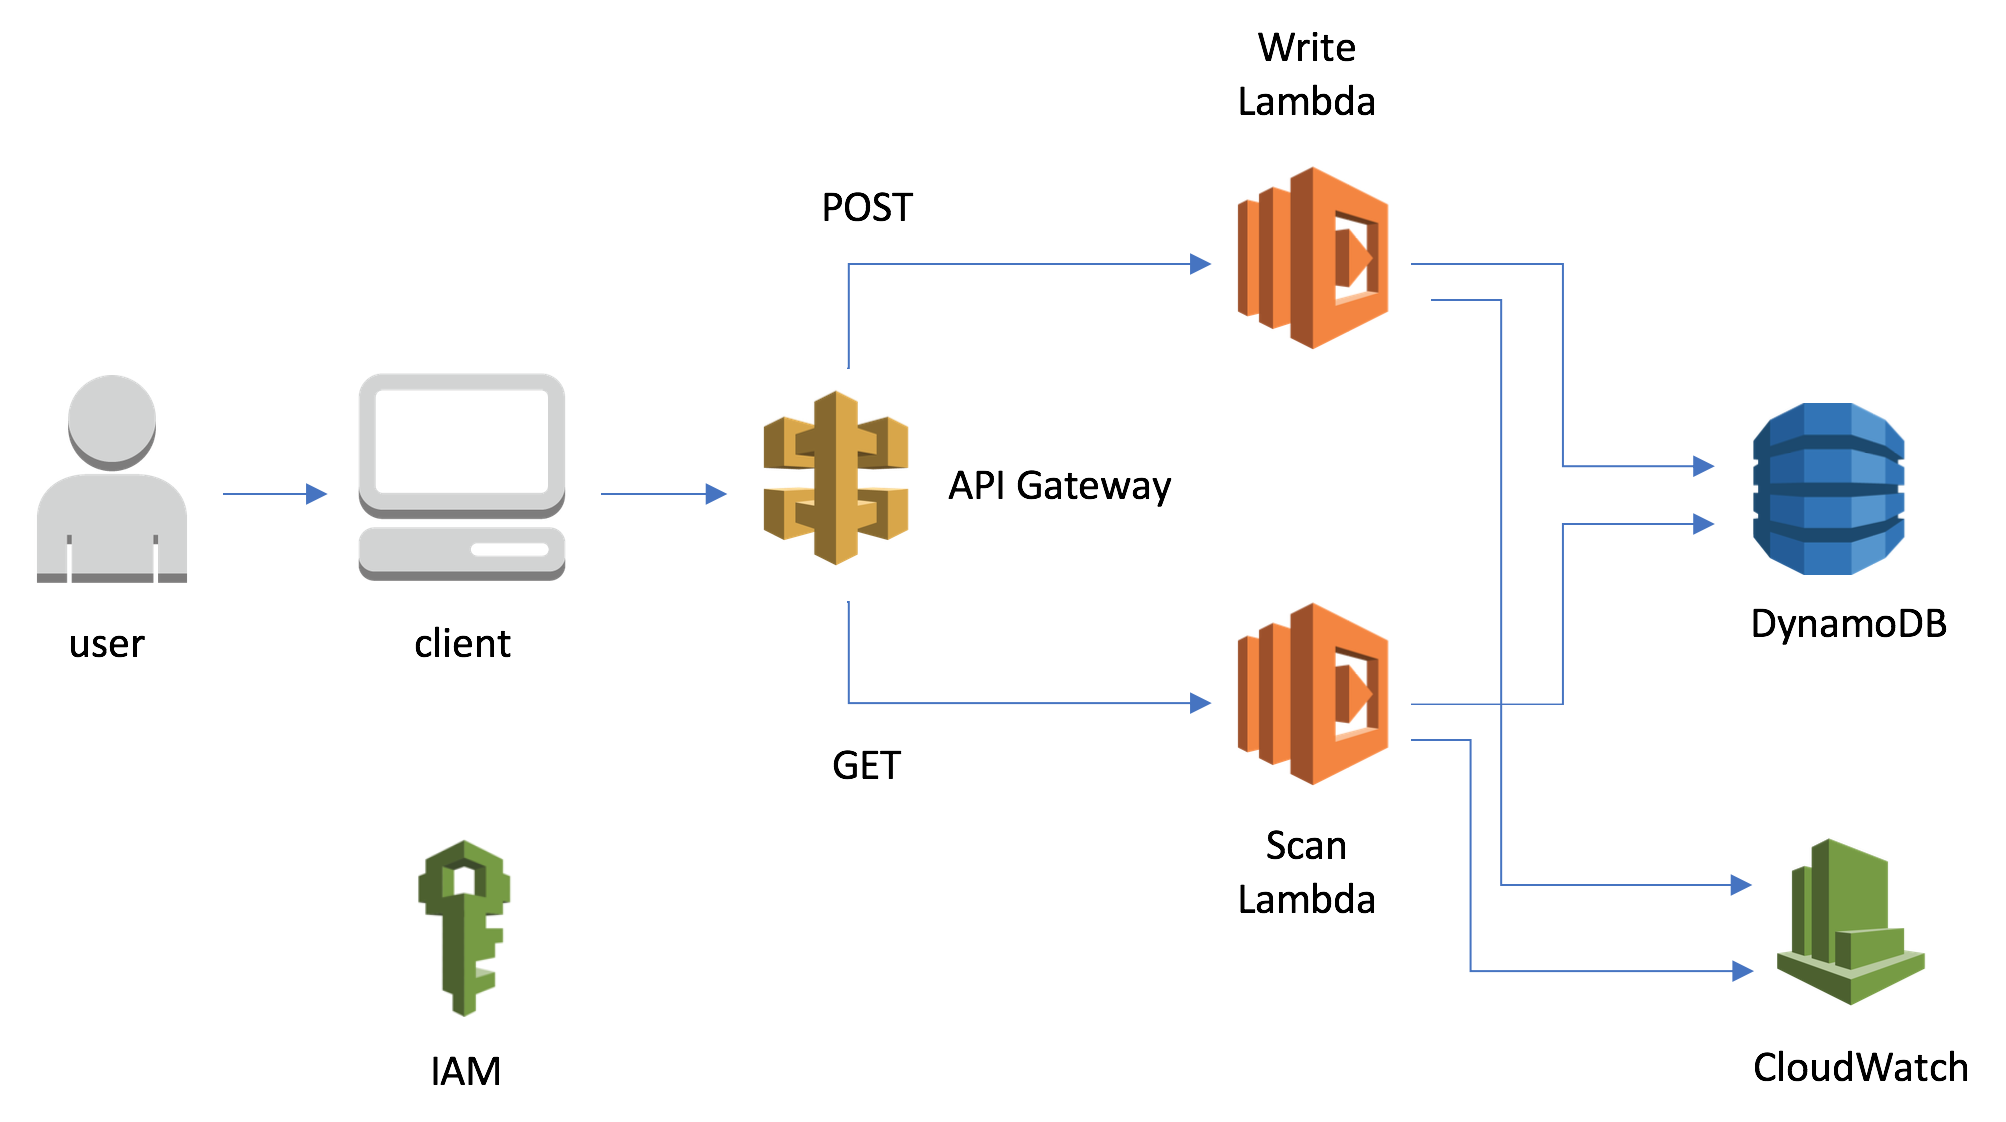
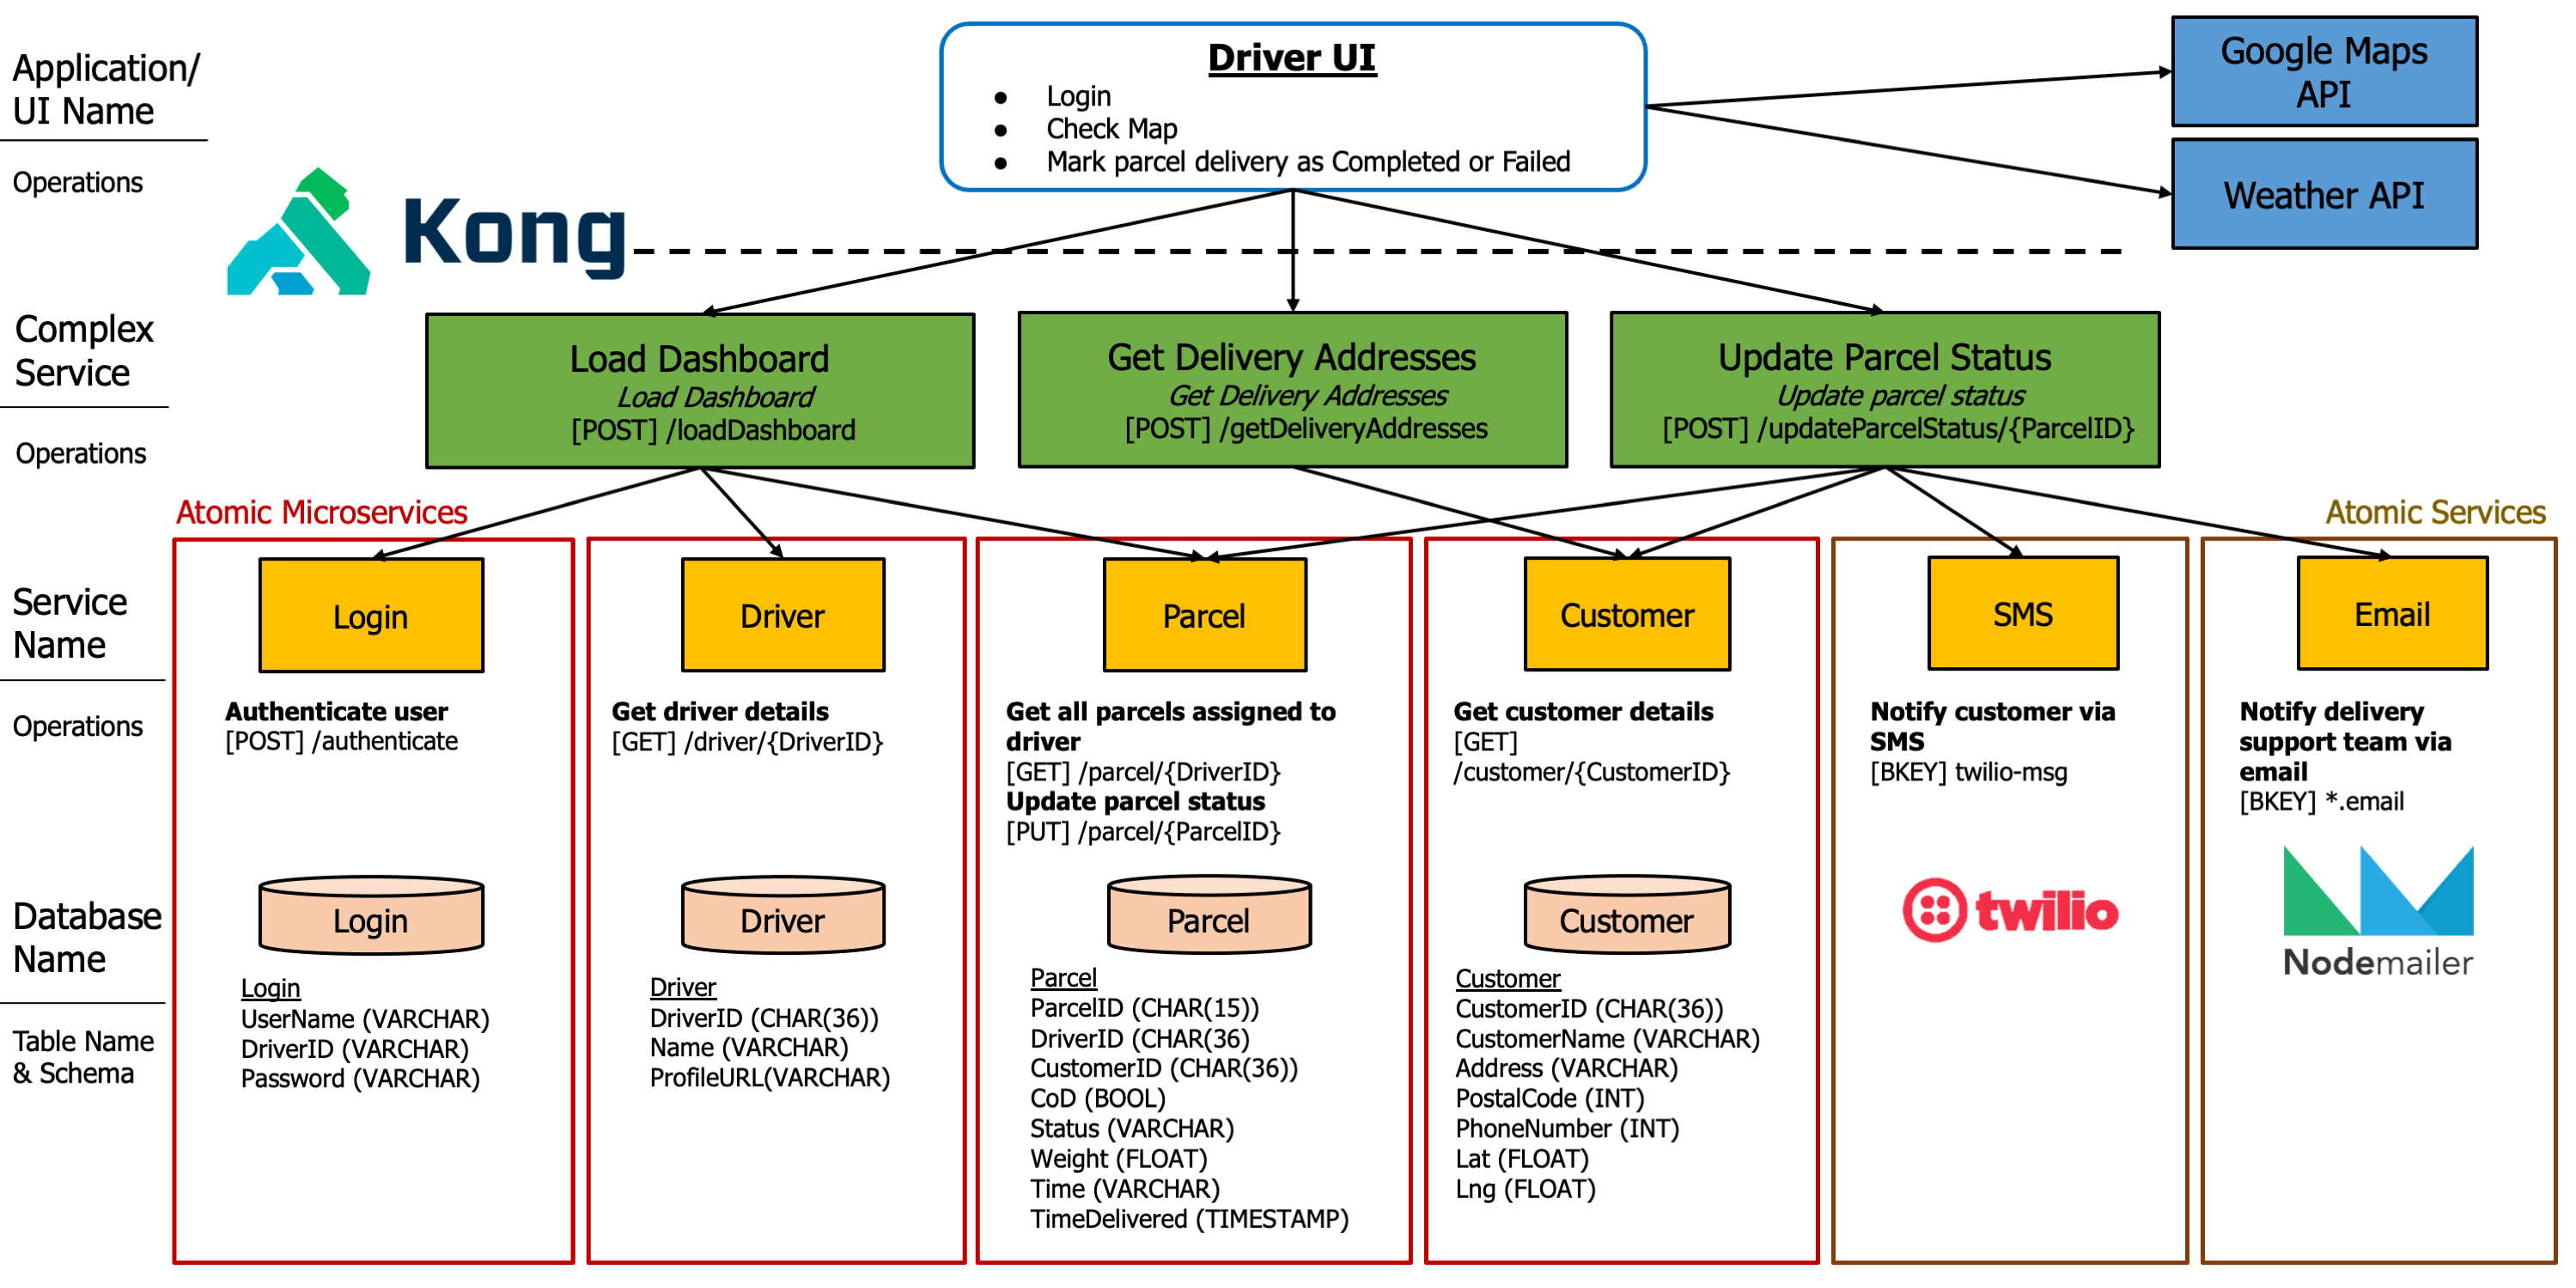
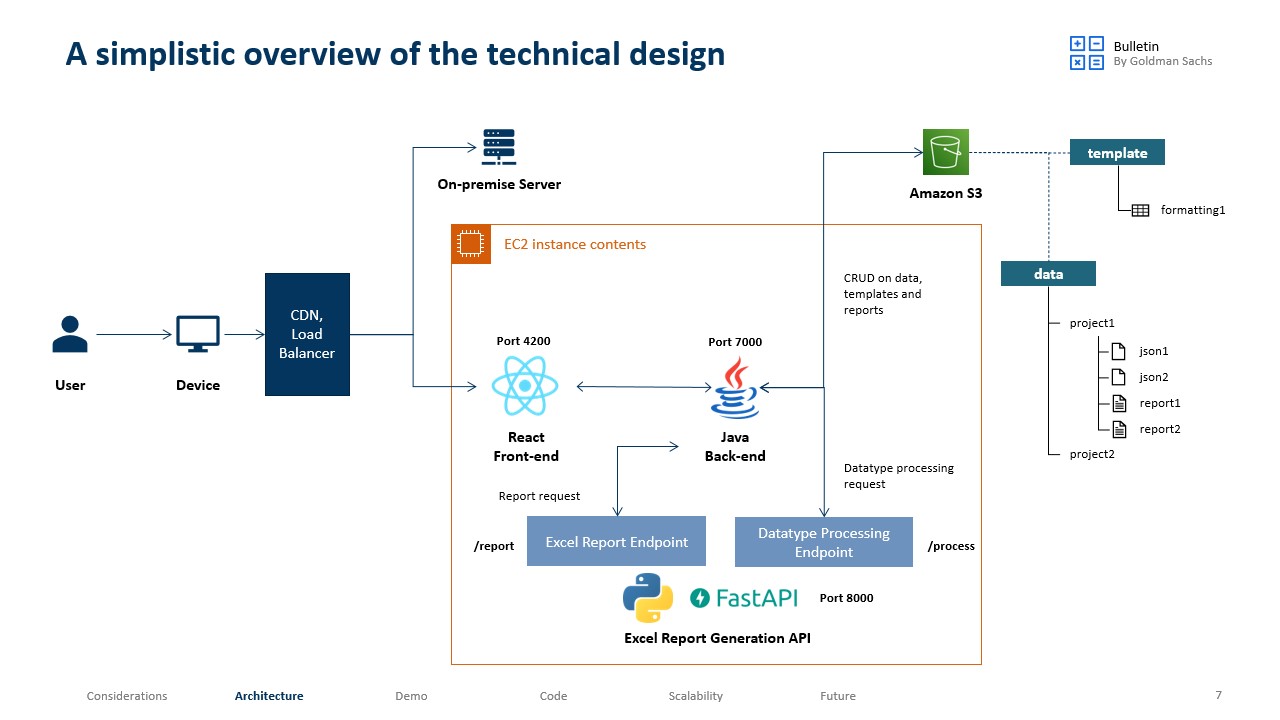
Architecture
This diagram shows the technical implementation of this applicaiton. We adopted a cloud approach with the use of S3 as a storage solution for your excel sheets.
Performance
Measured on a t2-medium AWS EC2 instance (4gb RAM, 30gb Memory)
| Small Report (10 Rows x 1 Column) | Medium Report (5 Rows x 5 Columns) | Large Report (10 Rows x 10 Columns) | |
|---|---|---|---|
| 10 Concurrent Reports | 0.85s | 38.72s | 137s |
| 1000 Concurrent Reports | 14.03s | 173s | 13mins |
- Concurrent load scales well with small-sized, single sheet reports
- Considerable load scalability with medium-sized reports
Built With
Frontend
Backend
API
Acknowledgments
Big thanks to these awesome engineers who helped build this idea!